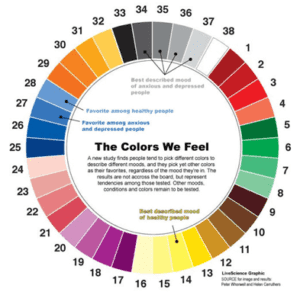
An Indian team of doctors recently developed a color wheel that they say can be used to decide if mood affects color choice. The wheel, known as the “Wasseypur Color Wheel” (they obviously were spent after the research and could only muster a rather generic name for their invention), is composed of a spectrum of colors on a wheel, and subjects were asked to point to the color that best described their mood. The study group consisted of 300 healthy subjects and around 220 subjects suffering from some type of anxiety or depression.
Three questions were asked of the subjects, i.e.
(1) which color they were most drawn to;
(2) what was their favorite color; and
(3) if there was a particular color that described their current mood.
The results showed that while a majority of both groups chose yellow as the color they were most drawn to, most everyone also chose a shade of blue as their favorite color. But when asked what color reflected their present mood, the healthy participants chose a shade of yellow, while the depressed group chose a shade of gray.
Following on the heels of this experiment, a group of Manipal Bloggers attempted to use the Wasseypur Color Wheel theory on a group of Manipalites who were neither diagnosed with depression nor normal to see what their moods were when asked 4 key questions about
(1) the continuous rain; (2) Bus transport services (3) MU’s new International Food Court; and (4) Increasing course fees.
“Talk about opening a can of worms,” said researcher, Jwalit Rag. “Who knew how riled up Manipalites were about their present situation. I mean, we had Freshers so tense that we had to pry their fists from the special button presser thingie, because they just were outraged at how their lives had taken such a turn for the worse. We had to literally lie to them and tell them that the results would produce a system whereby they would get the benefits they had been promised if they would just turn loose of the buzzers. It was bizarre, to say the least.”
And it was the same for just about everyone across the board, from the Faculty to the owners of shops at Sutta-point to out-of-work Xerox wallas, the results were the same. In fact, the only group that didn’t even show up on the chart because they were so far from norm were the students who were up for placement interviews and the final semester guys, who, for reasons unknown, were unable to take part in the survey.
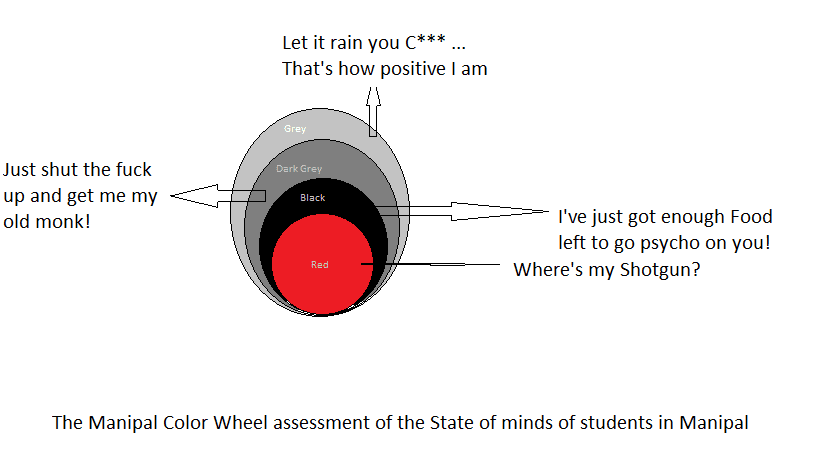
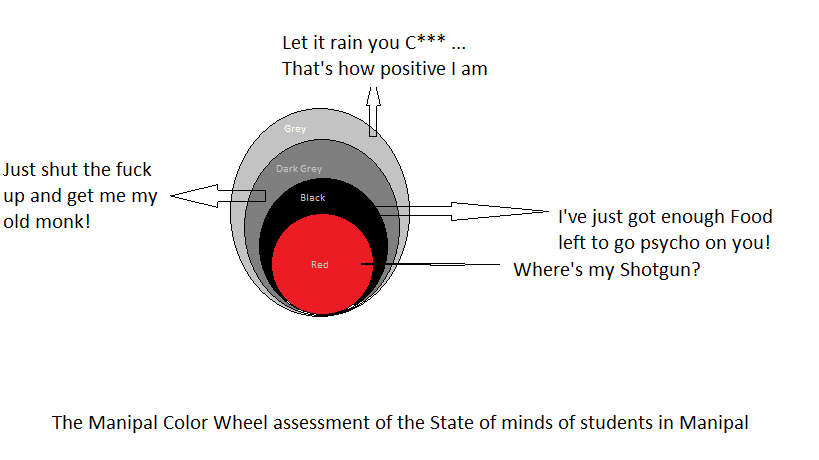
While the Manipal “Mood-o-Meter” only showed shades of gray and red, the results were decidedly a bit more colorful than those attained by the Indian team. Find the Manipal results below:

P.S: All the facts in this article are made up! But you already knew that didn’t you?

Be the first to comment