The famous Italian mathematician, who lived in the city of Pisa, was named Leonardo and nicknamed Pisansky. Although his family and friends called him Fibonacci – in Italian – “son of Bonacci”. The man of science is known, first of all, for the so-called “Book about the Abacus”, which he wrote at the beginning of the 13th century (abacus-for counting).
In the Fibonacci sequence, each subsequent number is formed from the sum of the previous two. It is quite curious that there is another connection between the numbers. For example, with the number 5, any subsequent number exceeds the previous one by about 1,618 times. On the other hand, any number is approximately 0.618 of the one following it. Traders also use Fibonacci numbers in trading – here they are called levels. They began to apply Fibonacci levels as soon as they saw that price fluctuations are often similar to the specified sequence.
And not just similar – but so detailed that even the most popular copy trade software, use these sequences.
How to use Fibonacci on Forex?
The set of technical indicators based on Fibonacci numbers includes the following tools:
- Lines;
- Arcs;
- Fan lines;
- Time zones;
- Expansion.
In this article, we will look at the Fibonacci lines (or levels) – the most popular and effective tool for analyzing charts. Along with software the trader needs to know the following SimpleFX Review on using Fibonacci numbers:
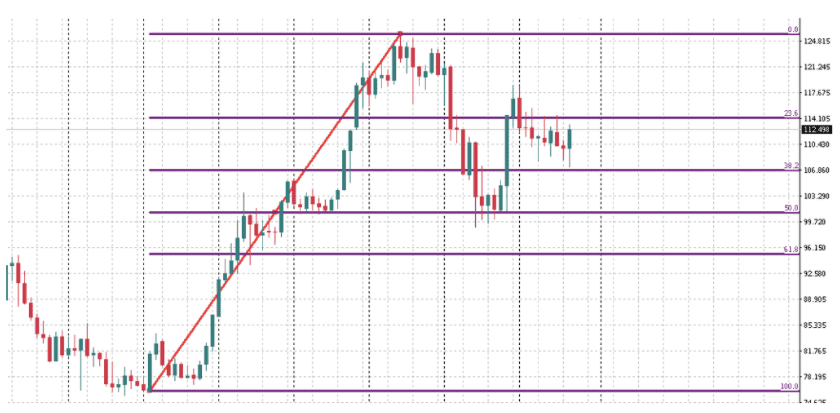
- We use Fibonacci levels when a strong correction is formed after a strong trend. In this case, we sort of” pull ” a grid with Fibonacci levels on a scale from 0% to 100% on the previous trend.
- We get correction levels of 23.6, 38.2, 50, 61.8, and 76.4% of the completed trend. These relations are the main indicator that is able to predict the potential price movement. Quite often, the price is reflected by a rebound from these levels. These lines – both when trading a currency pair (Forex) and when working with securities (stock market) – can work as both support and resistance levels.
- The higher accuracy of the set levels is due to a longer time interval.
In other words, the trader only needs to find the completed trend, correctly set the Fibonacci levels, see the confirmation and only then make a decision about opening a deal. In trading, there are a large number of ways to use these numerical series. In this article, we consider the most versatile, it is able to provide profitability in most assets if the market has moderate volatility.
How to build Fibonacci lines?
 To correctly place the lines, you will need to identify the trend, then open the indicator and set the grid along the entire length of the trend – we begin to “pull” the grid from the point of completion of the trend and bring it to the point of origin of the trend. We go from the end to the beginning!
By the way, some traders are of the opinion that the trend consists of a 5-wave structure, which will ensure the leveling of false signals, ensuring even greater accuracy of the Fibonacci levels. Forex is a fairly flexible platform for earning money, so you can adjust the Fibonacci levels according to your work style. One of the popular strategies is as follows:
- Plotting a grid on a 4-hour chart. Moreover, the base is the general trend (1-6 months).
- An hourly chart is used for daily trading. Only once correctly constructed levels will help you work for up to six months.
- On average, the period of an open order is about 2-3 days (less often-a week or more).
- All transactions are made in the direction opposite to the construction of the levels (i.e. in the direction of the current trend).
- Gold and silver are an example of a qualitative application of Fibonacci. The GBP/USD pair has also proven itself well.
In countries where the national currency is tied to oil, the Fibonacci levels are not so effective.
Which Fibonacci levels are stronger?
Quite a large number of traders believe that not every Fibonacci level works equally according to the price chart, and they even revealed some sequences:
- 23,6%. A weak level that requires precise confirmation.
- 38,2%. An important level. The value of the asset is likely to rebound (consolidation).
- 50%. Something averaged between the previous points-perhaps the level will work out as it should.
- 61,8%. Similar to 38.2%. 76.4%. A strong level.
If you take into account the strength of the levels in Forex, follow the trend, and ignore small time intervals (less than 1H), you will reduce risks and increase profits. Especially the Fibonacci levels, which are quite simple and understandable to understand, are effective when used in parallel with indicators.

Be the first to comment